- HOME
- Technical Information
- AMILAN™ Nylon Resin
- Mechanical properties
Mechanical properties
Ⅰ. Tensile characteristics
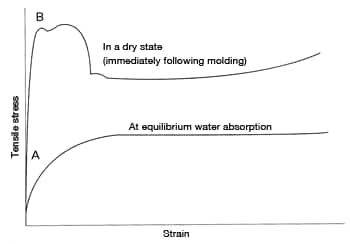
Figure 1: Nylon stress-strain curve
Tensile characteristics are generally expressed using a stress-strain curve. Figure 1 shows a typical tensile stress-strain curve of non-reinforced nylon in a dry state and at equilibrium water absorption. As you can see, water absorption creates a smoother strain-stress curve. Furthermore, necking occurs beyond the yield point (point B in Figure 1). Thereafter, elongation progresses rapidly. Actual designs use a safe stress tolerance obtained by dividing the yield point stress by a certain measure of safety. For nylons, a safety measure value of 3-8 is used in many cases. Nylon reinforced with glass fibers or other reinforcement fillers does not exhibit necking; instead they become brittle and fracture. Tensile strength is expressed in terms of yield point stress in materials that fail by yielding and fracture stress in materials that fail as a result of brittle fracture.
The elasticity modulus is used to express how easily a material deforms. In Figure 1, it corresponds to the slope of the proportional limit on the stress-strain curve (the straight line up to point A). The following is a formula to find the tensile modulus of nylon 66 at equilibrium water absorption (2.5%). Stress corresponding to 0.5% elongation, which is the proportional limit, is 7.5MPa.
Tensile modulus = stress/strain = 7.5MPa/0.005 = 1500MPa = 1.5GPa
The tensile characteristics of nylon depend greatly on temperature. Tensile strength and tensile modulus both decline as temperature increases. Water absorption also reduces tensile strength and tensile modulus, resulting in a temperature dependence curve that behaves like a dry nylon would at lower temperatures. The temperature dependence of tensile strength is shown in Figures 2 through 5 and the temperature dependence of tensile modulus is shown in Figures 6 and 7, using representative grades of nylon.
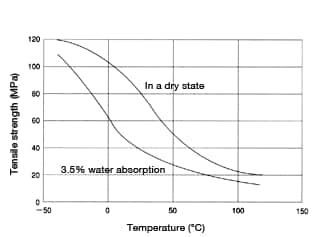 Figure 2: Temperature dependence of tensile strength
in CM1017
(non-reinforced nylon 6)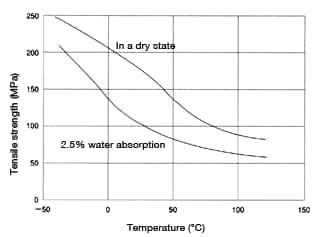 Figure 3: Temperature dependence of tensile strength
in CM1011G-30
(GF30% reinforced nylon 6)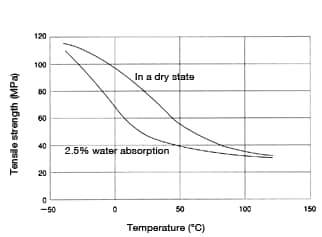 Figure 4: Temperature dependence of tensile strength
in CM3001-N
(non-reinforced nylon 66)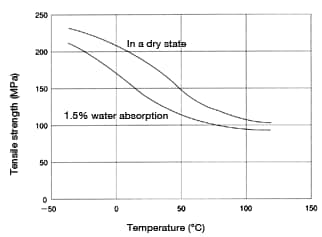 Figure 5: Temperature dependence of tensile strength
in CM3001G-30
(GF30% reinforced nylon 66)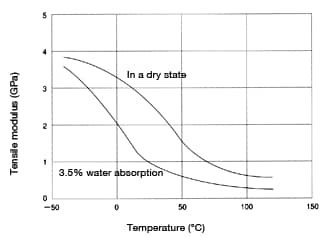 Figure 6: Temperature dependence of tensile modulus
in CM1017
(non-reinforced nylon 6)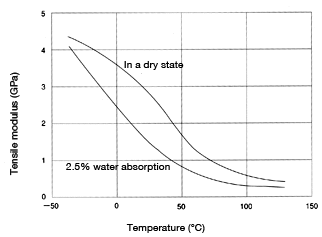 Figure 7: Temperature dependence of tensile modulus
in CM3001-N
(non-reinforced nylon 66)
Ⅱ. Flexural properties
Figure 8: Three-point flexural test
Flexural properties are generally evaluated using a three-point flexural test as shown in Figure 8. Metrics include flexural strength, flexural strain and flexural modulus.
- b:Test specimen width
- h:Test specimen thickness
- L:Distance between support points
- W:Load
- δ:Deflection
Given the above, stress δ and strain ε would be:
Formula (a) σ=(3L/2bh2)·W・・・(a)
Formula (b) ε=(6h/L2)·δ・・・(b)
Input load at break point into formula (a) to arrive at flexural strength. Input flexural strain at break point into formula (b) to arrive at flexural strain. Flexural modulus can be obtained by inputting deflection and load from one point along the straight-line section of the load-deflection curve into formula (c).
Formula (c) Flexural modulus=σ/ε=(L3/4bh3)·(W/δ)・・・(c)
Similar to tensile properties, flexural properties also exhibit dependence on temperature and water absorption. The temperature dependence of flexural strength is shown in Figures 9 through 12 and the temperature dependence of flexural modulus is shown in Figures 13 through 16, using representative grades of nylon.
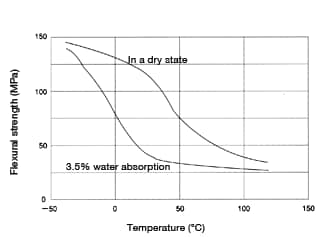 Figure 9: Temperature dependence of flexural strength
in CM1017
(non-reinforced nylon 6)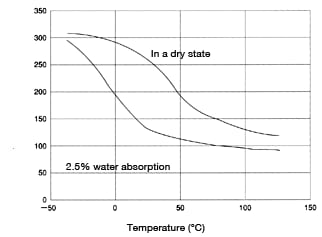 Figure 10: Temperature dependence of flexural strength
in CM1011G-30
(GF 30% reinforced nylon 6)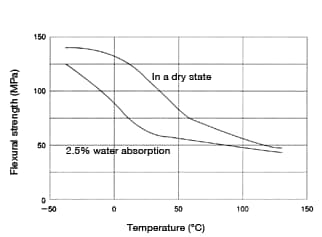 Figure 11: Temperature dependence of flexural strength
in CM3001-N
(non-reinforced nylon 66)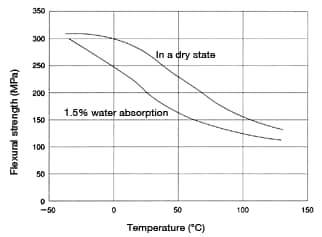 Figure 12: Temperature dependence of flexural strength
in CM3001G-30
(GF 30% reinforced nylon 66)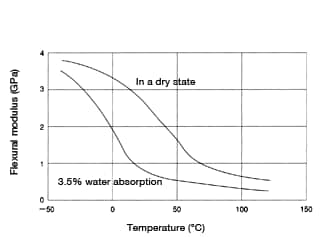 Figure 13: Temperature dependence of flexural modulus
in CM1017
(non-reinforced nylon 6)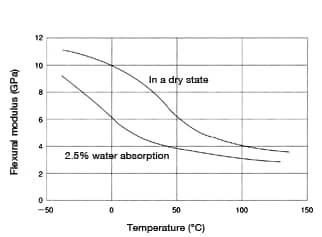 Figure 14: Temperature dependence of flexural modulus
in CM1011G-30
(GF 30% reinforced nylon 6)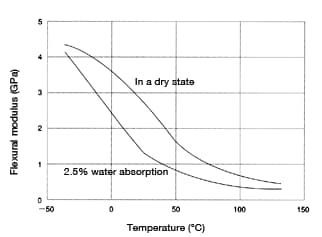 Figure 15: Temperature dependence of flexural modulus
in CM3001-N
(non-reinforced nylon 66)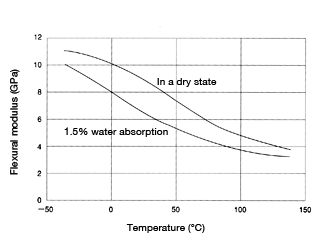 Figure 16: Temperature dependence of flexural modulus
in CM3001G-30
(GF 30% reinforced nylon 66)
Ⅲ. Compressive properties
The temperature dependence of compressive stress in non-reinforced nylon 6 is shown in Figure 17 and the water-absorption dependence of compressive strength in non-reinforced nylon 6 is shown in Figure 18. Table 1 shows the compressive strength of each nylon grade.
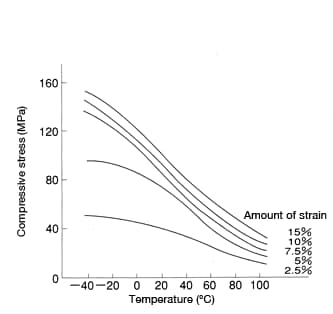 Figure 17: Temperature dependence of compressive stress in CM1017 (nylon 6)
(Dry state. Strain rate: 10%/minute)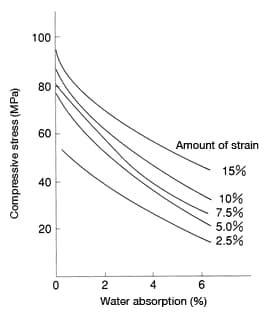 Figure 18: Water-absorption dependence of compressive stress in CM1017 (nylon 6)
(25°C. Strain rate: 10%/minute)
| Category | Unit | Nylon 6 CM1017 |
Nylon 610 CM2001 |
Nylon 66 CM3001-N |
|---|---|---|---|---|
| Yield strength (in a dry state) Yield strain (in a dry state) |
MPa % |
85 5 |
90 5 |
65 5.5 |
| Stress at 1% compressive deformation: In a dry state At equilibrium water absorption At saturation water absorption |
MPa MPa MPa |
26 5.5(3.8) 3.4(11.5) |
20 7.2(2.2) 5.2(3.8) |
28 8.0(3.7) 4.9(9.9) |
Note: Numbers in parentheses represent water absorption (%)
Ⅳ. Creep properties
Creep refers to the increase in strain over time under a constant load and is one of nylon's most important mechanical properties. Figure 19 shows the tensile and compressive creep of non-reinforced nylons 6 and 66 at room temperature. Figure 20 shows the temperature dependence of creep deformation in nylon 6 under a tensile stress of 10 MPa. Figure 21 shows the temperature dependence of creep deformation in nylon 6 and nylon 66 under a tensile stress of 20 MPa.
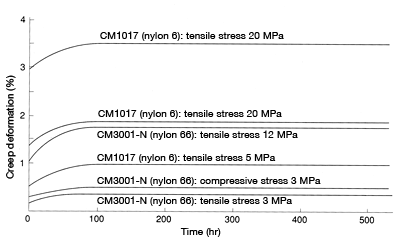
Figure 19: Creep deformation in CM1017 and CM3001-N
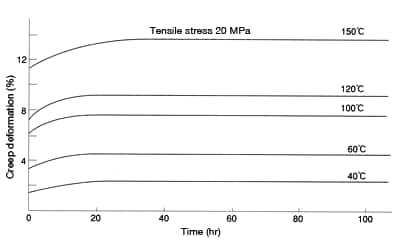
Figure 20: Change in creep deformation in CM1017 (nylon 6) at different temperatures (in a dry state)
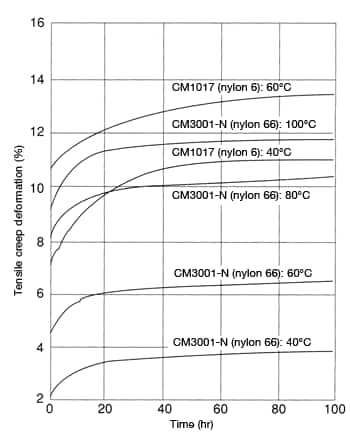
Figure 21: Tensile creep deformation in CM1017 (nylon 6) and CM3001-N (nylon 66)
(under a load of 20 MPa in a dry state)
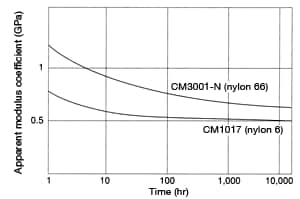
Figure 22: Apparent modulus coefficient
in CM1017 and CM3001-N
In practice, apparent modulus (elasticity modulus after a set amount of time has lapsed) is convenient to estimate the amount of deformation that might occur. Figure 22 shows the apparent modulus of CM 1017 (nylon 6) and CM 3001-N (nylon 66) at room temperature. This can be used to estimate how much deformation would occur in CM 3001-N (nylon 66) after one year under a stress of 20 MPa.
Based on Figure 22, the apparent modulus coefficient after one year (after 8,760 hours) is 0.66 GPa. Therefore, the amount of deformation after one year would be:
Amount of deformation=20MPa/0.66GPa≒0.003=3%
However, apparent modulus can only be applied when stress at room temperature does not exceed 20 MPa for CM1017 (nylon 6) and 22 MPa for CM3001-N (nylon 66).
Ⅴ. Impact strength
Nylons exhibit a great deal of impact strength relative to other resins. Figure 23 shows the water-absorption dependence of impact strength and Figure 24 shows the temperature dependence of impact strength. Nylon 6 and nylon 66 exhibit no difference at room temperature in a dry state and no difference in water-absorption dependence. However, nylon 6 has a higher water absorption at equilibrium and therefore should exhibit greater impact strength. Meanwhile, Figure 25 shows the crystallinity dependence of impact strength. As you can see, higher crystallinity results in lower impact strength.
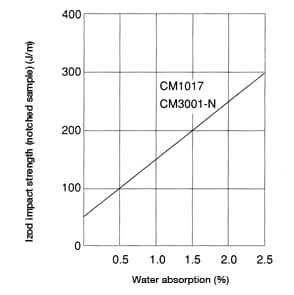 Figure 23: Water absorption dependence
of impact strength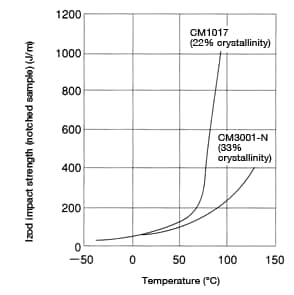 Figure 24: Temperature dependence of impact strength
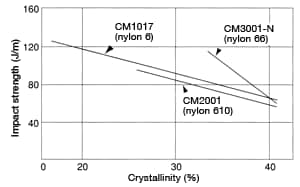 Figure 25: Crystallinity dependence of impact strength
Ⅵ. Surface hardness
Water-absorption dependence of surface hardness is shown in Figure 26, and the temperature dependence of surface hardness is shown in Figure 27. As you can see, surface hardness declines with increased water absorption or higher temperatures.
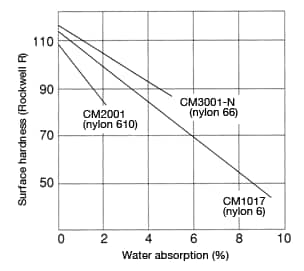 Figure 26: Water-absorption dependence
of surface hardness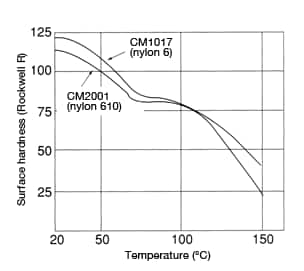 Figure 27: Temperature dependence of surface hardness