- HOME
- Technical Information
- AMILAN™ Nylon Resin
- Injection-molding
- Considerations to obtain the desired dimensions in a molded product
Considerations to obtain the desired dimensions in a molded product
Mold cavity dimensions
The cavity dimensions of a mold for forming an injection-molded product can be expressed by the following equation.
Formula 7: L=M(1+S-E)
Whereas:
L: Mold cavity dimensions
M: Product dimensions
S: Mold shrinkage
E: Dimensional change resulting from environmental and usage conditions (temperature, water absorption, creep and other variables)
Causes for dimensional change in S and E are described below.
Mold shrinkage
Ⅰ. Definition of mold shrinkage
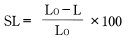
Linear mold shrinkage SL (what is ordinarily referred to as mold shrinkage) and volume mold shrinkage SV are defined by the following equations.
Formula 8:
Formula 9:
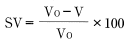
Whereas:
L0: Mold cavity dimensions
L: Product dimensions after leaving the molded product at room temperature for 24 hours after molding
V0: Mold cavity volume
V: Product volume after leaving the molded product at room temperature for 24 hours after molding
Assuming shrinkage occurs in an uniform and isotropic manner:
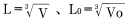
Input that into formula 8 to obtain:
Formula 10:
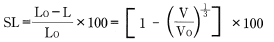
Ordinarily, however, shrinkage does not occur uniformly and isotropically, so formula 10 does not work.
Ⅱ. Causes of mold shrinkage
- Change in density between the molten polymer and the solidified and cooled product. (This is the main cause.)
- Elastic recovery and plasticity change resulting from decompression upon release from the mold
- Change in crystallinity
Nylons are particularly affected by crystallinity, which is dependent upon the shape of the temperature spectrum of crystallization speed (see note), the time spent in that temperature range and cooling time.
Note: The temperature spectrum shape changes depending on:
- The amount of pressure applied to the polymer
- The number of crystal cores containing internal strain
- Mobility of the polymer molecules
Ⅲ. Estimating mold shrinkage
Use the following sequence of measures to estimate mold shrinkage.
- Select the standard mold shrinkage rateα0from the product thickness and mold shrinkage rate information provided in Figure 5.1.
- Adjustα0to factor in mold temperature and cooling time.
Add 0.015 × (Tm-50)% if mold temperature Tm is higher than 50°C and cooling time is long.
Add 0.010 × (Tm-50)% if mold temperature Tm is higher than 50°C and cooling time is short.
Subtract 0.007 × (50-Tm)% if mold temperature Tm is lower than 50°C and cooling time is long.
Subtract 0.005 × (50-Tm)% if mold temperature Tm is lower than 50°C and cooling time is short. - Adjust for product shape.
No adjustment needed if the product is flat and planar with little concavoconvexity and no bosses or protrusions.
Subtract from the inner diameter and add to the outer diameter for cylindrical products such as bearings and bushings. The extent of the adjustment depends heavily on the complexity of the product shape, so use any accumulated data to enhance the accuracy of your estimate. When the mold core and pins obstruct absorption, residual stress arises and is frozen within the product interior. Water absorption and heating releases the residual strain, which then leads to shrinkage.
Complex molded products will have different mold shrinkage rates in different regions. Use a combination of i and ii to estimate shrinkage. - Molecular orientation occurs when the polymer material enters the cavity by way of the gates. Adjust accordingly based on the applicable orientation. In the case of non-reinforced grades, the extent of the adjustment is larger for the machine direction than for the transverse direction as the product thickness becomes thinner (2 mm or less), as the injection speed becomes faster, and as the mold temperature becomes higher. The converse applies to glass-fiber reinforced grades.
- Adjust accordingly to account for gate cross-section surface area.
Molding sample: 80mm×80mm×t mm
Gate: Film gate
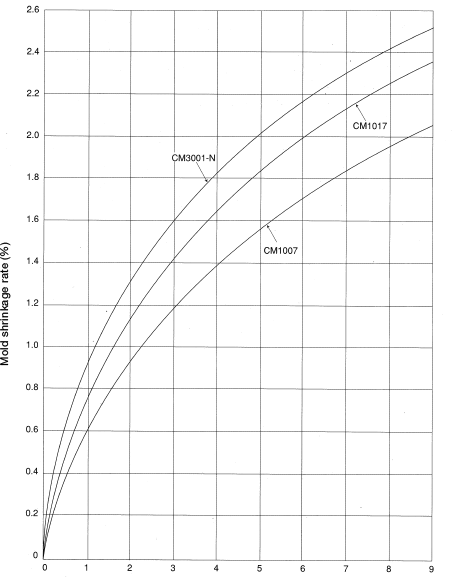
Figure 5.1: Product thickness (mm)
Molding conditions: Polymer temperature
CM3001-N ………………… 270-280°C
CM1007,CM1017………… 250-260°C
Mold temperature…………………… 40-60°C
Expansion and shrinkage caused by water absorption
Ⅰ. Water absorption
Nylon is a water-absorbent polymer; therefore, its mechanical properties and dimensions alike will change as it absorbs moisture. Understanding water absorption and taking the appropriate measures can help obtain highly precise molded products. Water absorption occurs when minute particles diffuse into a larger substance. Therefore, water absorption can be theoretically resolved by applying a diffusion equation.
Ⅱ. Rate of water absorption
To simplify matters, assume water is absorbed by a semi-infinite object in a one-dimensional direction. C(x,t) represents the amount of water in a place located distance x from the object surface at time t. Using these assumptions, the change over time in concentration C can be expressed as:
Formula 11:

Whereas:
D represents a diffusion constant.
Average concentration (t) based on measurements taken at arbitrary times from formula 8 can be expressed as:
Therefore:
Formula 12:
Whereas:
t:FTime lapsed (s)
C:FWater absorption (%) at time t
Cs:FEquilibrium water absorption (%) under the applicable environmental conditions (See Figure 5.2)
W = S/V: Shape coefficient (1/m)
S: Exposed surface area (m2)
V∵Volume (m3)
D:F Diffusion constant(m2/S)(See Table 5.1)
Please note that formula 12 can only be used to calculate the time required to reach up to 80% of equilibrium water absorption and is not applicable to water-absorption rates higher than 80%. For reference, Figures 5.3 and 5.4 show water-absorption curves based on actual measurements taken using a 60φ × 3 mm disc, immersed in 20°C water and at 60%RH, respectively.
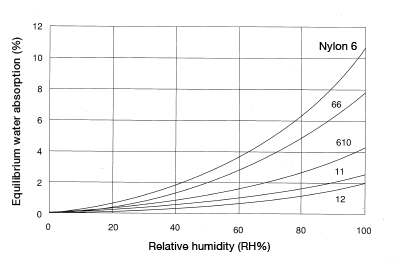
Figure 5.2: Equilibrium water absorption for each nylon grade (23°C)
| Nylon type | Conditions | Diffusion constant D (m2/S) | |
|---|---|---|---|
| CM1017 | Machined round bar | Immersed in 100°C water | 3.48×10⁻¹¹ |
| CM1017 | Injection-molded product | Immersed in 20°C water | 7.84×10⁻¹³ |
| CM1017 | Injection-molded product | 20°C,RH60% | 6.31×10⁻¹⁴ |
| CM1011G-30 | Injection-molded product | Immersed in 100°C water | 2.73×10⁻¹⁰ |
| CM1011G-30 | Injection-molded product | 20°C,RH60% | 1.75×10⁻¹⁰ |
| CM3001-N | Injection-molded product | 20°C,RH60% | 2.01×10⁻¹³ |
| CM3001-N | Injection-molded product | Immersed in 20°C water | 4.42×10⁻¹³ |
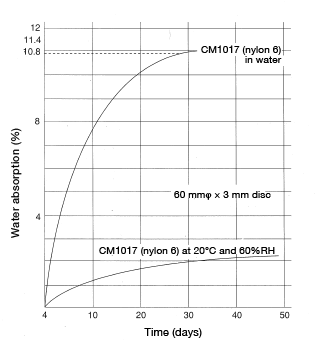 Figure 5.3: M1017 water-absorption curve
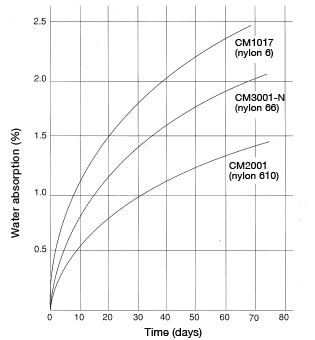 Figure 5.4: Change over time in water-absorption rate 60mmφ×3mm disc at 20°C, RH60%
< Exercise 1 >
Calculate the time required for a 60mmφ×3mm disc of CM1017 material to absorb moisture equivalent to 80% of equilibrium water absorption immersed in 20°Cwater.
< Answer >

According to Table 5.1, D = 7.84 × 10¹³m2/S.
Insert the above value into formula 12:

The answer is 330 hours, or approximately 13.2 days.
< Exercise 2 >
Calculate the time required for the above molded product to absorb moisture equivalent to 80% of equilibrium water absorption at 20°C and 60%RH.
< Answer >
According to Table 5.1,D = 6.31×10¹⁴m2/S W=733. Insert that value into Formula 12 to get:

The answer is 1,410 hours, or approximately 56.4 days.
Ⅲ. Water-absorption concentration distribution
The distribution of water-absorption concentration in a molded product can be found with the following equation.
Formula 13:
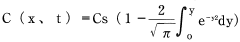
Therefore, concentration in a molded product at an arbitrary location and an arbitrary time can be calculated using an error function. We also know that the water-absorption rate of a molded product is the integral of the concentration curve.
< Exercise 1 >
Find the concentration distribution for a thick plate of CM1017 material immersed in 20°C water after 49, 100 and 529 hours.
< Answer >
Figure 5.5 (Cs = 10.8%)
< Exercise 2 >
Find the concentration distribution for the above material left exposed to the air at 20°C and 75%RH after 289, 1,024 and 7,056 hours.
< Answer >
Figure 5.6 (Cs = 5.5%)
 Figure 5.5: Analysis of CM1017 immersed in water
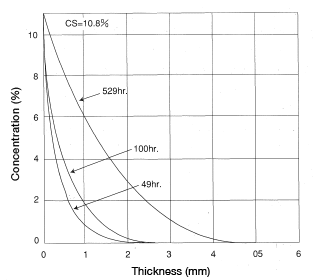 Figure 5.6: Concentration of CM1817 at 20°C, 75%RH
Ⅳ. Change over time in water absorption (or desorption)
Samples of a square plate(80mm×80mm×3mm)of CM1017 material were allowed to uptake water (treated in boiling water for 0.5, 1, 2 or 3 hours or immersed in room-temperature water). Another sample of the same material was not subject to any water immersion treatment whatsoever. The samples were then left in a room at a constant temperature(23.0±1°C)) for 450 days. Change in water absorption over time was measured. The results are shown in Figure 5.7. Japan humid rainy season had the effect of increasing water absorption on a slight time lag.
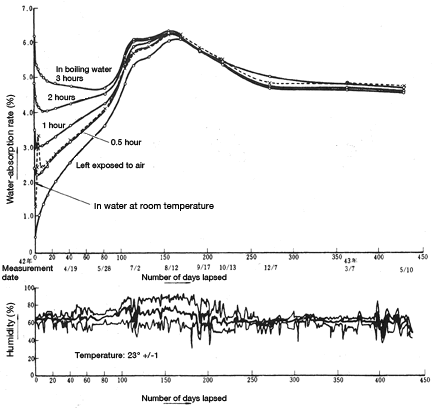
Figure 5.7: Change over time in water absorption/desorption
Ⅴ. Cubical expansion coefficient resulting from water absorption
A square plate(80mm×80mm×3mm and 5mm of CM1017 material was measured for cubical expansion coefficient (rate of increase in volume) resulting from water absorption. The results are shown in Figure 5.8. The empirical formula is β=0.86X(Formula 14), where β: cubical expansion coefficient; X: water-absorption rate. As you can see, in the case of nylon 6, for every incremental 1% in water absorption, volume increases about 0.086%.
Figure 5.8: Cubical expansion coefficient resulting from water absorption
Ⅵ. Linear expansion coefficient resulting from water absorption
Isotropic and uniform linear expansion
If linear expansion resulting from water absorption occurs in an isotropic and uniform manner, the follow equation can be induced.
Using the following definitions: V0=a × b × C,V=a × b × C(1+a/100)3
Formula 15:
Whereas:
V0: Molded product volume before water absorption
V: Molded product volume after water absorption
a, b, C: Length, width and height of the molded product
α: Linear expansion coefficient
β: Cubical expansion coefficient
Insert the value β = 0.86% from the empirical formula in the previous section into Formula 15 and α = 0.28%. That means that for each incremental 1% of water absorption, nylon 6 dimensions expand by about 0.28%.
Generally speaking, it is well known that nylon dimensions expand 0.2-0.3% with each incremental 1% in water absorption.
Ⅶ. Non-isotropic and non-uniform linear expansion
In an ordinary molded product, linear expansion resulting from water absorption is non-isotropic and non-uniform. The main cause is the relaxation of molecular orientation strain (due to polymer flow within the mold) and residual strain (frozen strain of mold shrinkage due to shape restraint in mold) as a result of water absorption.
Flat plates
A CM1017 disc (60mmφ×3mm and 5mm) and a CM1011G-30 square plate (80 mm × 80 mm × 3 mm) were measured in the thickness direction (z-axis) and the in-plane direction [in the x-axis (machine direction) and in the y-axis (transverse direction)] to find linear expansion resulting from water absorption. An example is shown in Figures 5.9, 5.10 and 5.11.
i. The rate of dimensional expansion in the thickness direction is exceptionally large. Moreover, the rate of expansion is larger with thinner molded products.
ii. A Dimensional expansion does not change significantly during the initial 2-3% of water absorption. Instead, the water absorption appears to lead to shrinkage.
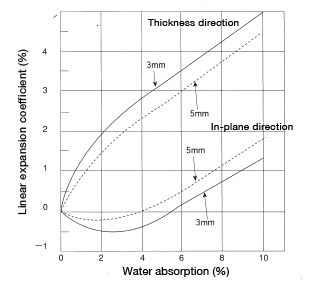 Figure 5.9: Linear expansion coefficient in a disc (60φ×3.5) resulting from water absorption (in-plane direction) Material: CM1017
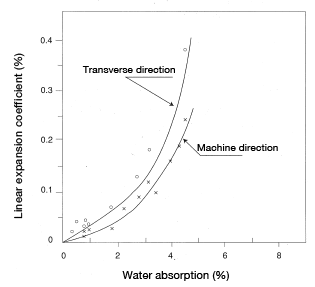 Figure 5.10: Linear expansion coefficient in a square plate resulting from water absorption (in-plane direction) Material: CM1011G-30
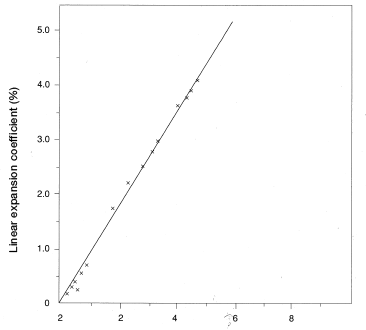
Figure 5.11: Linear expansion (thickness direction)in a square plate resulting from water absorption Material: CM1011G-30
The results are believed to be attributable to relaxation of molecular orientation. Here, we will explain molecular orientation strain. Molecular orientation comprises filling orientation, packing orientation and cooling orientation. Filling orientation refers to the state in which molecules are oriented in the direction in which the polymer flows when filling the cavity. When the polymer is rapidly compressed into a cold mold, the layer contacting the mold surface rapidly cools and slows to a nearly still state while polymer continues to push forward at a more rapid rate. This results in shearing stress across the layers formed in the flow direction. The polymer chains are stretched and oriented. Glass-fiber reinforced nylon will orient in a manner that is aligned with the orientation of glass fibers. Also, the thinner the molded product the greater the orientation will be.
Packing orientation refers to the result of a subtle shift in molecular orientation that occurs while the polymer flows within the mold cavity during the time window between after filling is complete and the plunger secondary pressure seals the gates. If the injection time (hold time) is too short, polymer may escape the mold cavity by way of openings the gates are meant to seal, until internal pressure reaches zero. In any event, until the gates seal shut, the polymer will flow toward lower pressure regions. As a result, molecular orientation shifts some.
Cooling orientation refers to the orientation caused during the cooling cycle by the movement of internal polymers pushed toward lower temperature regions where coagulation is occurring. The orientation is greater where the product thickness is non-uniform. In other words, molecules are oriented perpendicular to the surface of air bubbles or voids.
The above describes the three types of molecular orientation. In particular, filling orientation has a pronounced presence in a molded product. So how is molecular orientation influenced by water absorption? Let’s look at the process. Each polymer layer formed is oriented respectively in the machine direction. Water penetration between those layers easily contributes to expansion in the product thickness direction. However, the in-plane direction is quite long and molecules work against each other to inhibit expansion. Elongation in the thickness direction facilitates the recoiling of molecules and even causes shrinkage in the in-plane direction.
Cylindrical products
CM1017 bearings (outside diameter: 60 mmφ; inside diameter: 54 mmφ; height: 30 mm) were measured for the rate of change in the dimensions of inside diameter and outside diameter resulting from water absorption. The results are shown in Figure 5.12. The results show: ① the linear expansion coefficient of inside diameter was smaller than that of the outside diameter. Moreover, in the range of 1-4% water absorption, the inside diameter dimensions shrink rather than expand. Even the outside diameter sees little expansion in the range of 1-3% water absorption.
②You can see that the sample immersed in 100°C water exhibits a smaller linear expansion coefficient than the sample immersed in 20°C water.
③The cause of③①is in part the relaxation of molecular orientation strain, as described in the previous section. But the main cause is believed to be the relaxation of residual strain resulting from constraints imposed by the mold shape (core and other parts) that arise when the polymer is being cooled. In other words, residual strain is more readily relaxed at higher temperatures and where there is water absorption. That would explain the phenomenon behind ②.
General molded products
Dimensional change in general molded products resulting from water absorption can be thought of as a combination of that of flat plate and cylindrical products.
Formula 16: Ew = A-B-C
Whereas:
A: Expansion resulting from water absorption. There is 0.25-0.3% expansion for every 1% water absorption.
B: Shrinkage caused by the relaxation of molecular orientation strain. This is influenced by gate locations (polymer flow direction) and molded product thickness.
C: Shrinkage caused by the relaxation of residual strain. This is influenced by mold shape, core and molding conditions.
Generally values for A, B and C are generated empirically and need to be captured in day-to-day data-collection activities.
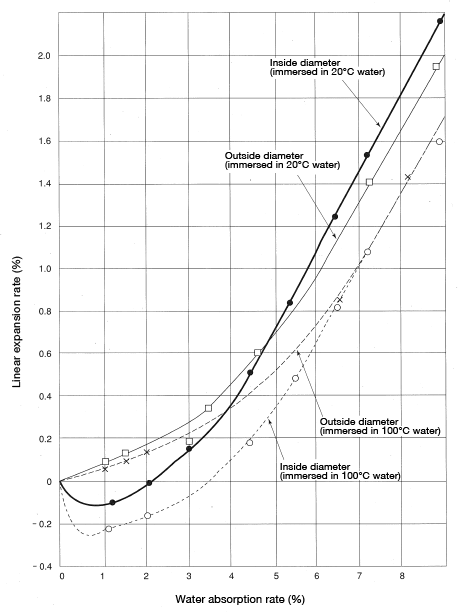
Figure 5.12: Bearing (60φ×54×30) dimensional change rate resulting from water absorption
Expansion and shrinkage as a function of temperature
Nylon and other general plastic molded products undergo substantial dimensional change as a function of temperature, so exercise caution. Plastic molded products tend to soften and deform at high temperatures and could crack at low temperatures in areas around metal inserts.
Dimensional change as a function of temperature can be calculated using the polymer’s linear expansion coefficient, but in reality this measure is difficult to apply. Residual strain in plastic molded products relaxes. Moreover, because nylon is a crystalline polymer, the progression of crystallization leads to disparity in linear expansion coefficients. Furthermore, generally speaking thermal expansion and shrinkage work anisotropically in plastic molded products. The same applies to the water absorption discussed above. A more detailed discussion follows.
Ⅰ. Thermal expansion coefficient
Table 5.2 shows the linear expansion coefficient for each nylon type. These values were measured using heat-treated samples free of any residual strain.
| Nylon type | Linear expansion coefficient |
|---|---|
| Nylon 6 | 0.8×10⁻⁴/°C |
Nylon 66 |
1.0×10⁻⁴/°C |
| Nylon 610 | 1.2×10⁻⁴/°C |
| Nylon 12 | 1.2×10⁻⁴/°C |
Ⅱ. Higher crystallinity as a result of heat treatment
The crystallinity of nylon allowed to sit in an open environment may be influenced by mold temperature as discussed above. Ordinarily, however, the crystallinity falls within the range of 5-15%. Using water, liquid paraffin, silicon oil or quenching oil in heat treatment at a high temperature will lead to higher degrees of crystallinity. Measurement results are shown in Figure 5.13.
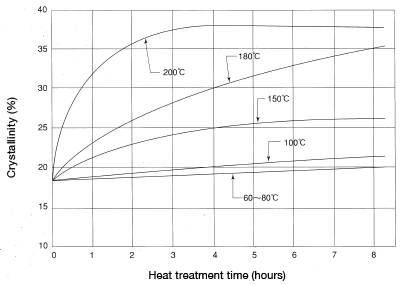
Figure 5.13: Change in crystallinity as a result of treatment
Interestingly, the surface layer and the interior of a molded product have different crystallinities; the surface layer having lower, the interior having higher crystallinity. Heat treatment, however, brings crystallinity to a uniform level throughout the molded product. Please see Table 5.3. Disparities in crystallinity in a molded product caused by variance in molding conditions and other factors can be corrected and made uniform by means of heat treatment.
| Data collection site of sample | Molded sample | With heat treatment (175°C×0-5)hr |
|
|---|---|---|---|
| Gate | Surface layer | 25 | 31 |
| Center layer | 30 | 33 | |
| Center | Surface layer | 25 | 32 |
| Center layer | 30 | 33 | |
| Ends | Surface layer | 24 | 31 |
| Center layer | 29 | 33 | |
Here we will explain crystallinity.
Nylon is a crystalline polymer, but in most cases nylon is not perfectly crystalline. Rather it is made up of a mixture of crystalline and amorphous material. Crystallinity refers to the crystalline content as a proportion of the total and can be defined as follows.
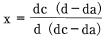
Whereas:
dc: Density of crystalline material
da: Density of amorphous material
d: Density of the sample
| Nylon type | dc | da |
|---|---|---|
| Nylon 6 | 1.212 | 1.113 |
| Nylon 66 | 1.24 | 1.09 |
| Nylon 610 | 1.157 | 1.041 |
Ⅲ. Relaxation of residual strain
Generally residual strain can be categorized into two types: molecular orientation strain and cooling strain resulting from the product shape. Expose a sample to a temperature above the glass transition point and its molecules exhibit more thermal motion, which causes residual to relax.
Currently, it is extremely difficult to measure a nylon injection-molded product to identify to what extent residual strain is present. If a substantial amount of residual stress is present, test means include: causing solvent cracks in a 5% sulfuric acid, 5% sodium hydroxide aqueous solution; measuring thermal expansion coefficient; and carving out an internal circumference.
Compared to other thermoplastic resins such as polystyrene and polycarbonate, generally speaking, nylon is resistant to cracks caused by residual stress. This is attributable to increased breaking elongation and decreased elastic modulus resulting from nylon’s ability to absorb moisture.
A CM3001-N bearing (outside diameter: 31.75 mmφ; inside diameter: 26.26 mmφ; height: 25.40 mm) was measured for dimensional change resulting from annealing treatment (155°C for 0.5 hour). The measurement results are shown in Table 5.5. The crystallinity described in the previous section is believed to contribute an incremental effect on the dimensional change resulting from the heat treatment. But the dimensional change is primarily attributable to the relaxation of cooling strain as a function of the molded product shape (suppression by the core of mold shrinkage).
| Molding conditions | Inner diameter shrinkage loss (%) | Length shrinkage rate (%) |
|---|---|---|
| Mold temperature(°C) | ||
| 21 38 65 93 |
1.5 1.3 1.0 0.3 |
0.6 0.3 0.4 0.1 |
| Molding cycle time (sec) | ||
| Injection time / cooling time 20/20Injection time / cooling time 20/20 20/10 10/5 |
1.3 1.2 0.5 |
0.3 0.4 0.3 |
| Molding pressure (MPa) | ||
| 140 70 |
1.2 1.4 |
0.4 0.0 |
| Cylinder temperature (°C) | ||
| 315-270-260 345-285-260 370-285-260 |
1.2 0.9 0.8 |
0.4 0.5 0.5 |
Ⅳ. Creep deformation
Creep refers to the increase in strain (dimensional change) that occurs over time under a constant load (stress). Creeping occurs in plastics near room temperature, and is quite pronounced at high temperatures, of course. Figure 5.14 shows tensile creep deformation in CM3001-N and CM1017 under stress of 20 MPa.
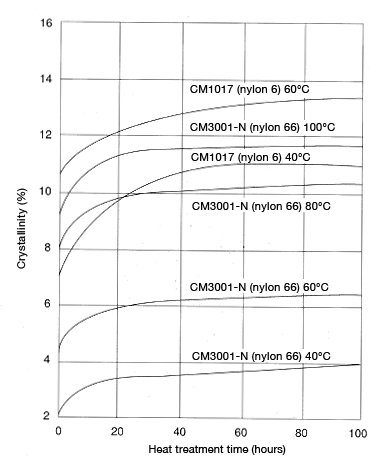
Figure 5.14: Tensile creep deformation in CM1017 (nylon 6) and CM3001-N (nylon 66) (Stress: 20Mpa)
Ⅴ. Occurrence of thermal stress
When nylon is left in a state where temperature-induced dimensional change would not arise, thermal stress arises in correspondence with the amount of deformation. Shrinkage thermal stress arises when temperature increases, and tensile thermal stress arises when temperature decreases. This could cause cracking if the plastic product has an insert.
Thermal stress can be expressed using the following equation.
Formula 17: σ=E × α × Δt
Whereas:
σ: Thermal stress(MPa)
E: Longitudinal elasticity modulus at that temperature(MPa)
α: Linear expansion coefficient(1/°C)
Δt: Difference in temperature(°C)
Failure occurs when thermal stress rises above twice the tensile and shrinkage break-down levels of the polymer. Moreover, when coupled with the effects of residual stress described in the previous section, failure occurs that much more easily.
(b)Conclusion
Expansion/shrinkage Et resulting from change in temperature can be summarized as follows.
①Changing from room temperature to a high temperature
Formula 18: Et=1 × α × Δt-Δρ-ε+Ec
Whereas:
1 × α × Δt: Linear expansion
1: Molded product length
α: Linear expansion coefficient
Δt: Difference in temperature
Δρ: One-dimensional direction of volumetric shrinkage resulting from increased crystallinity (density)
ε: Shrinkage resulting from the relaxation of residual strain
Ec: Expansion resulting from creep deformation (tensile stress)
②Changing from room temperature to a low temperature
Et=1 × α × Δt
The molded product may crack when thermal tensile stress is suppressed by an insert or the mold shape, particularly when residual stress is substantially frozen.
Shrinkage resulting from relaxation of residual stress
As discussed in the previous section, stress and strain that remains in a molded product include (1) strain resulting from thermal stress caused by rapid cooling of the molten polymer, (2) strain resulting from molecular orientation and (3) strain resulting from a change in the volume (density) near the softening point and melting point. These types of strain relax as a result of the water absorption and temperature change described above. The relaxation leads to dimensional shrinkage.
Ⅰ. Strain resulting from thermal stress
Polymer entering the mold acts hydrostatically at the instant the polymer comes into contact with the mold wall, and stress works in a direction that is perpendicular with the mold wall. The polymer’s outer surface gradually cools and hardens. The outer surface of the polymer then forms a rigid body even as molten polymer flows inside. As cooling progresses further, compressive stress arises in a direction that is tangential to the product surface and remains present as residual stress and strain in the molded product even as the temperature drops to room temperature. This thermal stress is frozen (relaxed) depending on complexity of the cavity (mold cavity shape) and the presence of inserts. General molded products contain much of this kind of residual strain.
Thermal stress appears in a molded product as a result of the following phenomenon. If the pressure of the polymer inside the mold falls as cooling progresses and the pressure zero point appears in the beginning of cooling, the portions of the outside surface that are coagulating are unable to hold stress. As a result, sink holes or depressions appear in the molded product.
If the pressure zero point appears around midway through cooling the molded product center part is still fluid and thus pulled to the outside surface. As a result, bubbles (voids) appear.
If the pressure zero point appears toward the end of cooling, no sinkholes or bubbles appear. Instead, residual strain remains. This phenomenon is strain resulting from thermal stress.
Ⅱ. Molecular orientation strain
Molecular orientation strain was explained in the section on expansion and shrinkage. Here we will discuss only filling orientation again. When the molten polymer enters the mold under pressure, the slope of shearing stress at the mold wall causes flow orientation to arise in the polymer molecules, which align in the flow direction of the molecular chain. If in this case temperature is high, the molecules will shrink thermoplastically. Because cooling begins on the outside, relaxation resulting from this thermoplastic shrinkage is restricted and freezes due to interactions between molecular chains. As a result, residual strain forms and remains within the molded product. This molecular orientation strain is greater in thin molded products. So you can see why mold shrinkage exhibits anisotropy.
If molecular orientation remains in force in a molded product, molded product dimensions will shrink as a result of water absorption and change to higher temperatures. Apparently, this will cause cracking in polystyrene. (Molecular orientation strain does not cause cracking in nylon, however.)
Ⅲ. Strain resulting from a change in volume (density)
Nylon is a crystalline polymer; therefore, density changes around its melting point. The effects of crystallinity cannot be ignored, either. If this change in density (volume) is physically halted, residual strain will remain in the molded product. However, generally, the strain relaxes over time and therefore is not particularly important.
Ⅳ. Relaxation of residual stress
The residual stress and relaxation of strain described above is influenced by water absorption and temperature, which are described in more detail in previous sections.
Molding precision
Figure 5.15 shows the variance in molding dimensions of each type of nylon that can be expected when performing continuous molding using the same molding machine under constant molding conditions (cylinder temperature, mold temperature, cycle, injection pressure, etc.).
The difference between crude, standard and precise is determined by to what extent molding conditions can be kept constant, as well as by the molding machine, mold temperature and material flowability, to name a few.
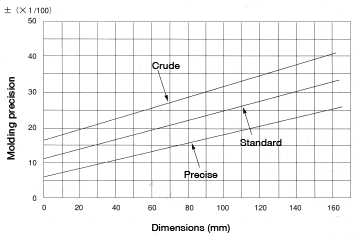
Figure 5.15: Molding precision
Treatments to stabilize nylon molded product dimensions (summary)
Ⅰ. Dimensional precision of a molded product
Primary causes for dimensional error in nylon molded products
- Causes directly related to the mold
Basic structure of the mold
Model of the mold
Error in fabricating the mold
Mold wear - Causes related to the molding process
Types of molding methods
Fluctuation in molding conditions
Fluctuation in mold operation - Causes related to molding materials
Grade change
Variance among lots
Amount of lubricant added - Change over time in the molded product
Changes in water absorption due to water absorption and desorption
Temperature change
Creep change Consider the sum effect after estimating dimensional precision for each of the above cause categories.
Ⅱ. Additional treatments to stabilize dimensions
- Heat treatment
Heat treat at a temperature about 10-20°C higher than the temperature at which the molded product will be used. Calculate the heat treatment time using a heat conductivity equation. Any heat treatment agent is acceptable, as long as it does not attack nylon, is stable vis-à-vis heat, and is safe to work with. In general, water, liquid paraffin, or silicon oil for quenching are preferable. Stir the coolant well. Also, be careful to avoid overheating in isolated locations.
When heat-treating many small parts in one batch, it is convenient to insert the parts into a metal cage.
Once the desired heat treatment is complete, remove the parts from the bath, insert the parts into a cardboard box or something similar to remove heat.
If the molded products are to be used at temperatures no higher than 70°C, treatment in boiling water should suffice (in light of the points made in the following paragraph as well). - Water absorption treatment
Investigate the humidity at which the molded product will be used, and ascertain the product’s equilibrium water absorption using Figure 5.2. Perform water absorption treatment to a level about 1-2 percentage points higher than the product’s equilibrium water absorption.
Calculate water absorption treatment time using Formula 12. The same method for heat treatment may be used for water-absorption treatment. - Moisture regulating treatment
Do not assume that water absorption treatment alone will result in the molded product absorbing enough water to stabilize. As shown in Figures 5.3 and 5.4, water absorption varies across the part; where the surface area may have 10% water content the part’s interior could have only 0%. Leave the molded product in the type of atmosphere in which it will be used to allow for moisture to regulate. Provide three weeks or more, depending on the thickness of the molded product, to allow for sufficient moisture regulation. See Figure 5.7 for an example.