- HOME
- Technical Information
- TORELINA™ PPS Resin
- Various Properties
- Mechanical Properties
- Tensile Properties
Tensile Properties
Ⅰ. Tensile Strength
Tensile strength is the most basic static strength. It can be determined from the maximum load that a test piece can support when pulled at a constant rate in a direction perpendicular to the cross-section of the test piece, in accordance with Formula 5.1. Tensile strength can be classified into two types, conventional stress, whereby the maximum load is divided by the initial cross-sectional area, and true stress, whereby the maximum load is divided by the cross-sectional area at fracture. This technical document treats conventional stress as tensile strength.
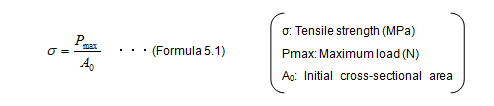
Table. 5.1 Tensile properties of TORELINA™ (23℃)
| Item | Units | Glass fiber reinforced | Glass + filler reinforced | Elastomer improvement | Unreinforced | |||||
|---|---|---|---|---|---|---|---|---|---|---|
| A504X90 | A604 | A310MX04 | A610MX03 | A673M | A575W20 | A495MA2B | A900 | A670T05 | ||
| Tensile strength | MPa | 190 | 195 | 130 | 140 | 150 | 150 | 150 | 80 | 70 |
| Tensile elongation | % | 1.6 | 2.0 | 0.8 | 1.0 | 2.1 | 1.5 | 1.7 | 13.0 | 20.0 |
- ※Test method: Conforms to ISO 527-1 and -2.
Ⅱ. Stress-Strain Curves (S-S Curves)
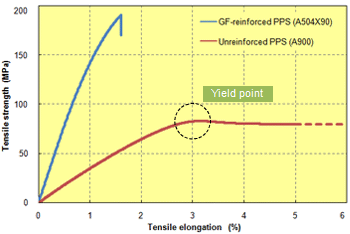 Fig. 5.1 Stress-strain curves (23℃)
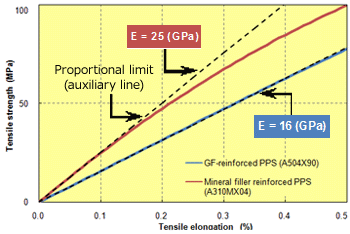 Fig. 5.2 A310MX04/proportional limit
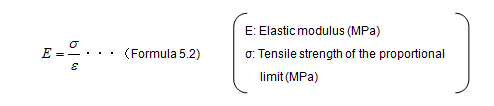
The mechanical properties, as represented by the tensile properties, can be expressed by stress-strain curves (abbreviated to "S-S curves" in the remainder of this document). (Fig. 5.1) In general, a material's tensile strength is expressed by the maximum value of its S-S curve. However, for unreinforced PPS grades (such as A900), which mainly exhibit a yield point, the tensile strength is expressed by the yield strength, and for reinforced PPS grades (such as A504X90 and A310MX04), which exhibit brittle fracture before reaching a yield point, it is expressed by a fracture strength. That region of an S-S curve where the tensile strength increases linearly in proportion to the strain (proportional limit) shows an elastic deformation region, where the deformed material returns to its original state if the external force is removed. In general, the slope of this proportional limit is called the elastic modulus. The elastic modulus can be determined by drawing an auxiliary line to indicate the proportional limit of the S-S curve, in accordance with Hooke's law (Formula 5.2). The elastic modulus thus obtained shows that the higher the value, the harder the material is to deform (stiffer). Among others, the tensile elastic modulus may also be referred to as Young's modulus or the longitudinal elastic modulus. High-filler PPS grades, which are highly filled with glass fiber and mineral filler, such as A310MX04 and A610MX03, have a particularly high Young's modulus. (Fig. 5.2)
On the other hand, that region of an S-S curve that exceeds the yield point shows a plastic deformation region, where the changes in the tensile strength are small even when the strain increases, and the deformed material does not return to its original state even if the external force is removed. For unreinforced PPS grades (such as A900 and A670T05), necking may occur if the yield point is exceeded. Necking refers to that state whereby the material does not elongate uniformly but instead elongates locally.
Ⅲ. Features of Linear PPS and Cross-linked PPS
TORELINA™ products are available in two types, the cross-linked polymer type (including A504X90) and the linear polymer type (including A604), although the type and content of the reinforcement are the same for both. Because of the difference in the polymer structure, the cross-linked polymer type, as typified by A504X90 and A310MX04, has a high elastic modulus, whereas the linear polymer type, as typified by A604 and A610MX03, is excellent in terms of its tensile strength and elongation (toughness). (Figs. 5.3 and 5.4)
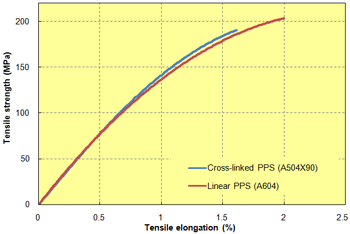 Fig. 5.3 GF-reinforced PPS/S-S curve (23℃)
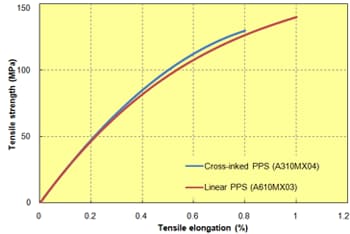 Fig. 5.4 High-filler PPS/S-S curve (23℃)
Ⅳ. Effects of Improvement with Elastomers
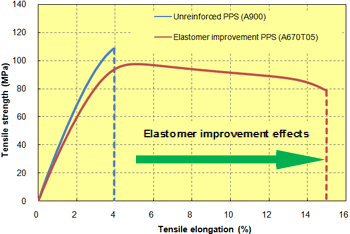 Fig. 5.5 Elastomer improvement PPS/S-S curve (-30℃)
TORELINA™ offers a lineup of grades improved with thermoplastic elastomers (abbreviated to "elastomers" in the remainder of this document), such as A575W20, A673M, A495MA2B, and A670T05. The effects of improvement with elastomers are various, and include the improvement of the moldability (blow moldability), mechanical properties, and secondary processability. In terms of the mechanical properties, in particular, elastomers are effective in terms of maintaining high toughness (elongation and impact resistance) and flexibility in low-temperature environments. (Fig. 5.5) Such low-temperature properties contribute to the improvement of the heat cycle resistance (cold cracking resistance) of metallic insert parts, the sealability of gasket parts, and so on. Elastomers are, however, inferior to PPS in terms of their thermal stability, so consideration must be given to heat resistance and mold contamination (mold deposits).
Ⅴ. Temperature Dependence
The temperature dependence of the tensile strength of nine representative grades of TORELINA™ is shown in Figs. 5.6 to 5.23. The tensile properties vary with the environmental temperature, but the reinforced grades maintain their high tensile strength over a wide temperature range. In particular, high-filler PPS grades, such as A310MX04 and A610MX03, which have a high reinforcement content, are notable in that they change little with the temperature. On the other hand, A673M, which is an elastomer improvement type with a low reinforcement content, as well as the unreinforced PPS grades, are highly temperature dependent, such that the tensile elongation increases abruptly at high temperatures. These phenomena are caused by the influence of the molecular motion of the PPS and elastomers, and differ from the strength decreases in that they are caused by the breakdown of the molecular chains (thermal deterioration). These changes increase notably when the glass transition temperature (Tg) (approx. 90℃ for PPS), at which the molecular mobility of the amorphous portion increases, is exceeded. (Fig. 5.6)
[General reinforced grades]
1 A504X90: Cross-linked PPS + 40% GF (standard)
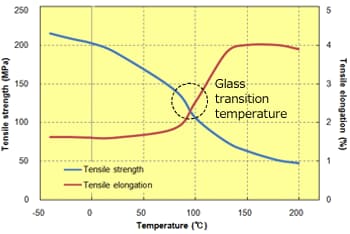 Fig. 5.6 Temperature dependence of tensile properties (504X90)
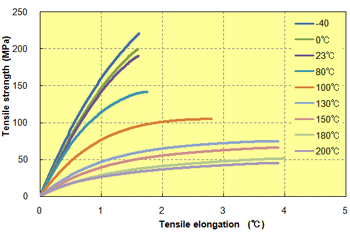 Fig. 5.7 Stress-strain curve (504X90)
2 A604: Linear PPS + 40% GF (toughness)
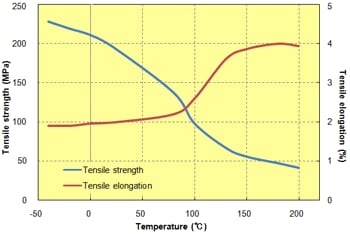 Fig. 5.8 Temperature dependence of tensile properties (A604)
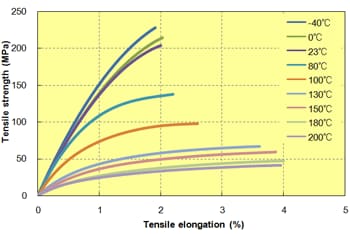 Fig. 5.9 Stress-strain curve (A604)
3 A310MX04: Cross-linked PPS + 65% (GF + filler) (standard)
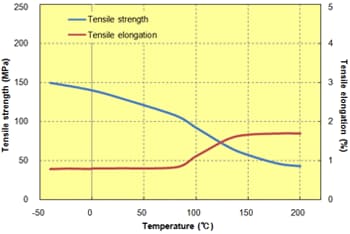 Fig. 5.10 Temperature dependence of tensile properties (A310MX04)
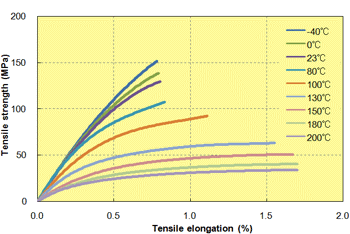 Fig. 5.11 Stress-strain curve (A310MX04)
4 A610MX03: Linear PPS + 65% (GF + filler) (toughness)
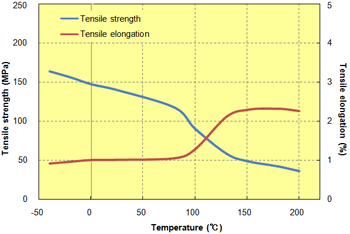 Fig. 5.12 Temperature dependence of tensile properties (A610MX03)
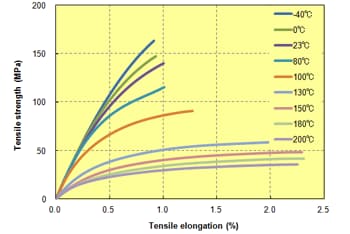 Fig. 5.13 Stress-strain curve (A610MX03)
[Elastomer improvement grades]
5 A673M: Linear PPS + 30% GF (toughness)
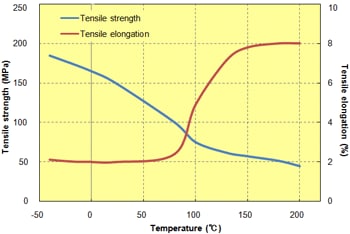 Fig. 5.14 Temperature dependence of tensile properties (A673M)
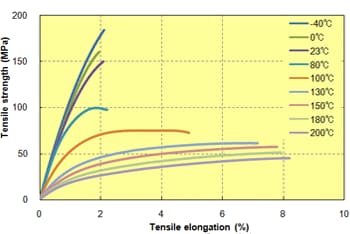 Fig. 5.15 Stress-strain curve (A673M)
6 A575W20: Cross-linked PPS + 50% (GF + filler) (high flow)
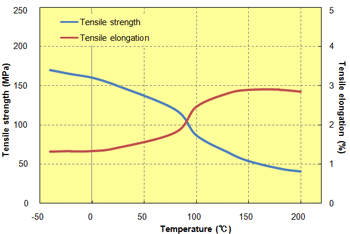 Fig. 5.16 Temperature dependence of tensile properties (A575W20)
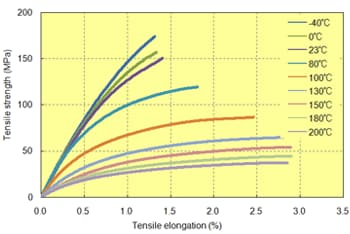 Fig. 5.17 Stress-strain curve (A575W20)
7 A495MA2: Cross-linked PPS + 50% (GF + filler) (good epoxy adhesion)
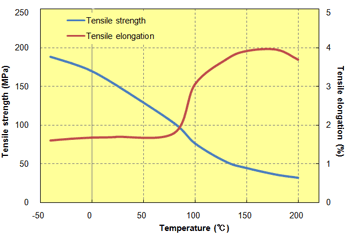 Fig. 5.18 Temperature dependence of tensile properties (A495MA2B)
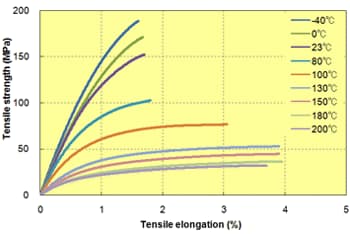 Fig. 5.19 Stress-strain curve (A495MA2B)
[Unreinforced grades]
8 A900: Linear PPS (standard)
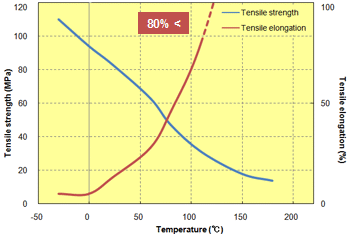 Fig. 5.20 Temperature dependence of tensile properties (A900)
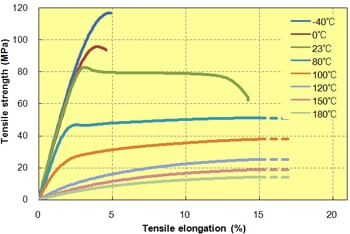 Fig. 5.21 Stress-strain curve (A900)
9 A670T05: Linear PPS + elastomer improvement (toughness)
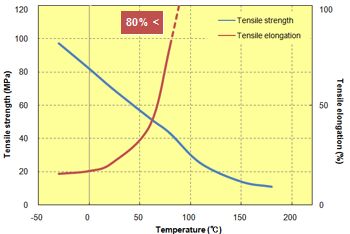 Fig. 5.22 Temperature dependence of tensile properties (A670T05)
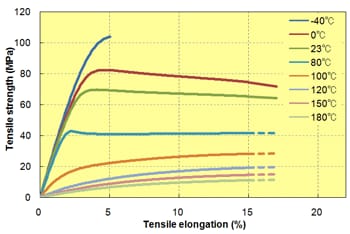 Fig. 5.23 Stress-strain curve (A670T05)