- HOME
- Technical Information
- TORELINA™ PPS Resin
- Various Properties
- Thermal Properties
- Thermal Conductivity
Thermal Conductivity
Heat-transfer phenomena, which cause objects subject to a temperature difference to assume a uniform temperature, are largely divided into thermal conduction, convection, and radiation, depending on the state of the flow path through which heat flows, and other factors. Thermal conduction is a phenomenon whereby heat moves through a solid or stationary gas (or liquid). Thermal conductivity is a property indicating the ease with which heat can move through a solid such as a molded product. Carriers (media) for carrying heat include free electrons, lattice vibration, and molecular vibration. The heat-transfer effect of free electrons is very high, so metals such as aluminum and copper have a high thermal conductivity. On the other hand, plastic materials such as TORELINA™ are insulating materials that do not have free electrons, so have a lower thermal conductivity than metals, and are superior in terms of their thermal insulating properties.
Ⅰ. Measurement of Thermal Conductivity
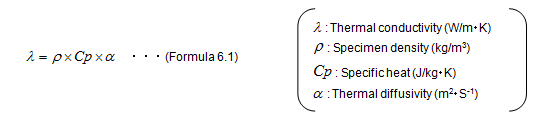
There are various methods for measuring the thermal conductivity of a solid. They can be classified into steady methods, in which the temperature of the specimen is in a steady state, and whereby the thermal conductivity is determined from the amount (heat flux, W/m2) that moves through a unit cross-section area per unit time, and unsteady methods, in which the thermal conductivity is determined from the rate at which heat is diffused through the specimen (thermal diffusivity, m2・S-1). Recently, unsteady methods, by which measurements can be obtained quickly, are most commonly used. These methods include the laser flash method and the hot disk method. The thermal conductivity can be determined by using the specimen density and the specific heat at the measurement temperature, in addition to the thermal diffusivity determined with an unsteady method, in accordance with Formula 6.1. Usually, thermal conductivity measurement uses a flat plate, so that with a steady method and the laser flash method, the thermal conductivity in the thickness direction can be determined, while with the hot disk method, the thermal conductivity in the planar direction can be determined in addition to that in the thickness direction. There is another method whereby the heat transfer of an actual molded product is checked visually, using thermography, which analyzes the infrared rays emitted from a molded product and this is then expressed on a temperature distribution chart.
Ⅱ. Thermal Conductivity of TORELINA™
The thermal conductivity of TORELINA™ in the thickness direction, as determined with a steady method, is given in Table. 6.3. Reinforced PPS has a higher thermal conductivity than unreinforced PPS. Glass-fiber and mineral-filler reinforcements have a higher thermal conductivity than the PPS polymer, so the thermal conductivity differs depending on the type and content of the reinforcement added.
Table. 6.3 Thermal conductivity of TORELINA™ (steady method, 80℃)
| Item | Units | Glass fiber reinforced | Glass + filler reinforced | Elastomer improvement | Unreinforced | |||||
|---|---|---|---|---|---|---|---|---|---|---|
| A504X90 | A604 | A310MX04 | A610MX03 | A673M | A575W20 | A495MA2B | A900 | A670T05 | ||
| Thermal conductivity (Thickness direction) |
W/m・K | 0.3 | 0.3 | 0.5 | 0.5 | 0.3 | 0.3 | 0.4 | 0.2 | 0.2 |
Ⅲ. Highly Thermal Conductive PPS
Highly thermal conductive PPS is suitable for prolonging the lives of electric and electronic parts such as LED lighting systems and for heat radiation design for purposes such as energy loss reductions for windings used in car motors. TORELINA™ offers a lineup of TORELINA™ H501B, an electroconductive type for which the thermal conductivity is improved drastically relative to a conventional PPS, and H718LB, which maintains its insulating properties. (Table. 6.4)
Table. 6.4 Highly thermal conductive PPS (23℃)
| Item | Measurement direction |
Units | Glass fiber reinforced | High-filler | Highly thermal conductive PPS |
Measurement method |
|---|---|---|---|---|---|---|
| Insulating type | ||||||
| A504X90 | A310MX04 | H718LB | ||||
| Thermal conductivity | Planar direction | W/m・K | 0.4 | 0.7 | 1.0 | Hot disk method |
| Volume resistivity | - | Ω・m | 2×10¹⁴ | 1×10¹⁴ | 5×10¹³ | - |
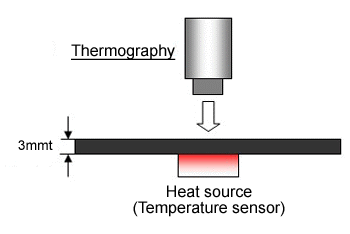 Fig. 6.7 Thermography analysis
In thermal analysis using thermography (Fig. 6.7), a heat source (3.4 W) is placed at the center of a flat plate (80 × 80 × 3 mm t), and observation is performed from the opposite side. Fig. 6.8 compares the temperature distribution charts obtained when a general glass fiber reinforced PPS grade (A504X90) and highly thermal conductive PPS grades (H501B and H718LB) are heated for five minutes. It can be seen that, for the glass fiber reinforced PPS grade, which has a low thermal conductivity, it is hard for the heat to diffuse from the heat source, thus forming a hot spot, whereas for the highly thermal conductive PPS grades, the heat diffuses to the surroundings, thereby limiting the size of the hot spot.
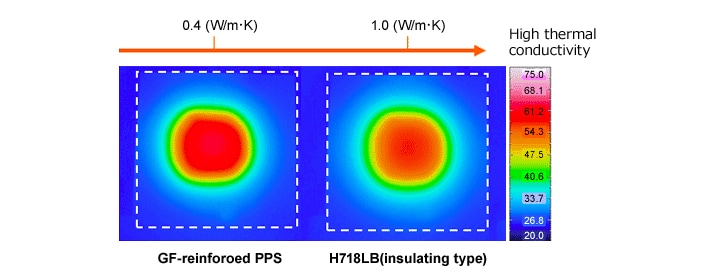
Fig. 6.8 Temperature distribution of highly thermal conductive PPS grades (thermography)